10 Useful KPIs in Supply Chain Management, Check Them Out
As a business owner, it is crucial to manage your supply chain efficiently in order to ensure the success of your operations.
Unless you do that, you may lose your competitive edge and put your customers’ satisfaction under risk.
Supply chain logistics are tough even at the best of times, but monitoring the processes of your supply chain continuously gives you insights to improve your business.
Let’s take a look at some essential supply chain management KPIs and metrics that enable you to identify the processes which improve your supply chain efficiencies and make your business more productive and more profitable.
What Is Supply Chain KPI?
Supply Chain Key Performance Indicators are metrics that can help businesses to track the effectiveness and efficiency of different supply chain operations.
It reflects an important impact on the health of the whole supply chain being the backbone of any modern business.
List of Supply Chain Management KPIs:
1: Cash to Cash Cycle Time
The cash-to-cash cycle time KPI represents the time period required from the moment of paying cash to a business’s suppliers till getting paid cash for the products from its customers.
It can be measured using three common financial metrics, which are, (DIO) days of inventory, (DOP) days of payables, and (DSO) days sales outstanding.
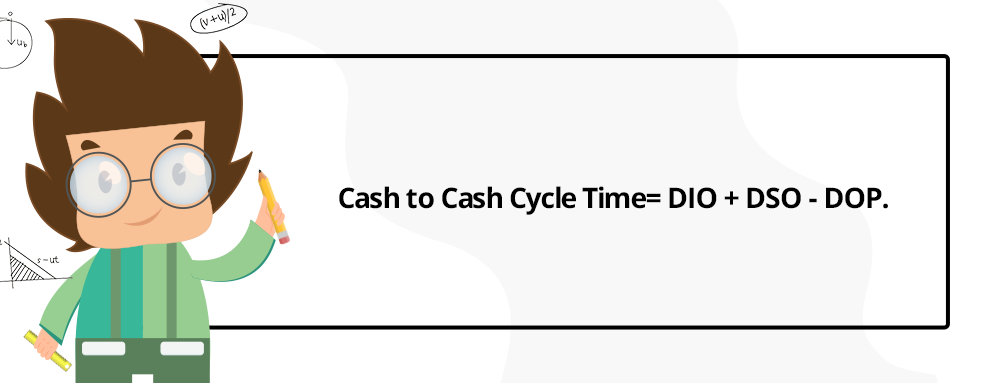
Cash to Cash Cycle formula:
Cash to Cash Cycle Time= DIO + DSO – DOP.
The shorter this KPI is, the better. A low value of cash-to-cash cycle indicates an increase in profitability and leanness. As well as this KPI gives important insights about the efficiency of your supply chain operations.
Read more about Cash to Cash here
2: Perfect Order Rate
This indicator holds the premiere position in the most important supply chain key performance indicators (KPIs) as it has a direct impact on customer satisfaction and retention levels. That’s why the higher this indicator, the better for overall supply chain effectiveness.
Perfect order rate is expressed in the percentage of orders that are delivered in full, on time manner, incident-free.
It helps you to solve issues such as delays, damages, and inventory losses, and enables you to track your order fulfillment process, storage, costs, and improve customer satisfaction.
Unlike most of supply chain KPIs, perfect order is a composite of several important elementary metrics related to processing and delivering orders.
The most important components of the perfect order indicator are as follows:
- On-time delivery. It represents the percentage of sales orders that are delivered on time.
- In-full delivery. It measures the percentage of sales orders that are delivered completely, it means that the right customer receives the correct products, in the right quantities.
- Damage-free delivery. It could be a stand-alone metric or sometimes incorporated into the in-full delivery KPI, it tracks the number of sales orders that are delivered in perfect case.
- Accurate documentation. It Measures the percentage of sales orders that are delivered to customers with accurate documentation. The documents mostly include advance shipment notifications (ASNs), packing lists, labels, and commercial invoices.
Perfect order formula:
((Total Number of Orders Number of Error Orders) / Total Number of Orders) * 100.

Number of Error Orders refers to On-time delivery, in-full delivery, damage-free delivery, and accurate documentation delivery.
3: Fill Rate
Another important metric in the list of supply chain management indicators is fill rate. This metric represents the percentage of orders that are successfully shipped with the first shipment with no need for additional shipments to fulfill the order.
Fill rate impacts customer satisfaction and provide businesses with insights into the efficiency of their own delivery service.
Fill rate also can be broken down into several metrics. For instance:
- Order Fill Rate. Monitors the percentage of orders successfully delivered on the first shipment.
- Line Fill Rate. Monitors the percentage of sales order lines successfully fulfilled on the first shipment.
- Unit Fill Rate. Monitors the percentage of items at each order successfully fulfilled on the first shipment.
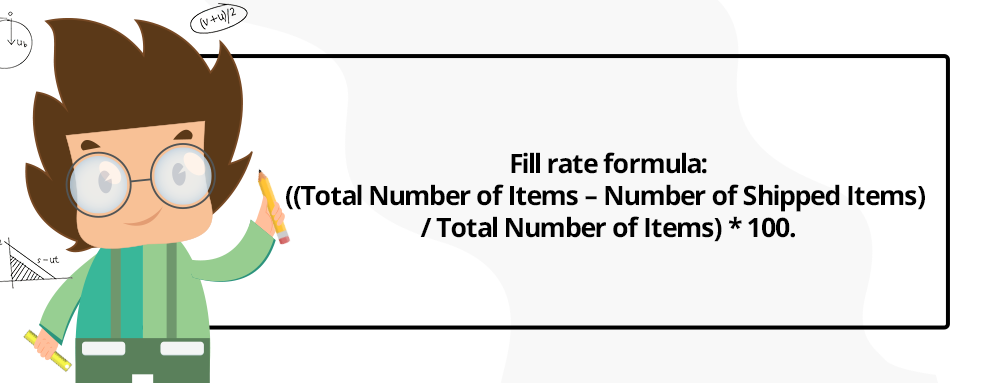
Fill rate formula:
((Total Number of Items – Number of Shipped Items) / Total Number of Items) * 100.
4: Customer Order Cycle Time
The customer order cycle time measures the number of days between the moment the customer places a purchase order and the moment the order is successfully delivered to the customer.
This metric is useful for evaluating customer service, and supply chain responsiveness.
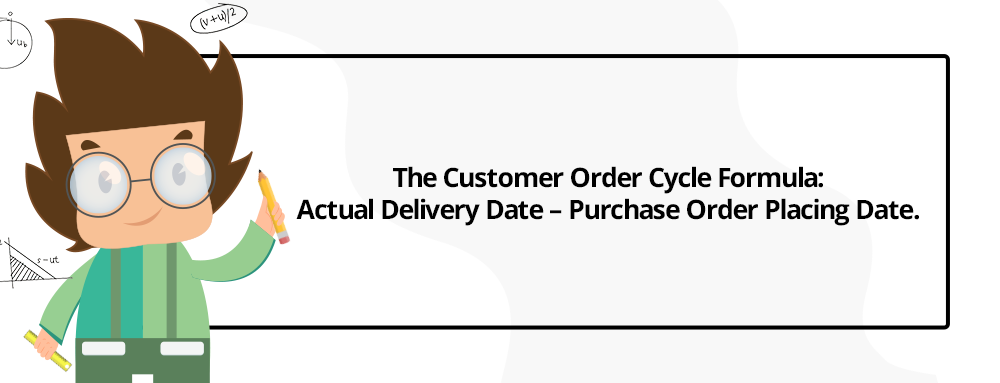
The Customer Order Cycle Formula:
Actual Delivery Date Purchase Order Placing Date.
5: Inventory Turnover
It is the most basic financial ratio for businesses that shows you the number of times inventory has been sold and replaced in a given time period.
This ratio tells you how fast and efficiently a company is making sales from its inventory, order fulfillment, marketing and sales operations.
If the turnover is low, it indicates the company has either weak sales or excess inventory. On the contrary, the high rate shows that the company has strong sales and there’s a market demand for their product.
Inventory turnover can help businesses make right decisions on pricing, marketing, manufacturing, and purchasing new inventory.
Inventory turnover ratio formula:
Cost of Goods Sold / [(Opening Stock – Closing Stock) / 2].
Read more about Inventory Turnover Ratio.
6: Inventory Days of Supply
Inventory days of supply Measures the number of days your warehouses could take to run out of stock without restocking.
This metric is useful as it will help you to avoid and prepare for any stock-based issues.
By tracking the amount of inventory in your warehouses day-to-day basis, you will be able to replenish it just in time which will save your reputation and investments.
Inventory days of supply formula:
Inventory on Hand / Average Daily Usage of Inventory.
7: Reasons for Return
Unfortunately, customer returns are not good for your supply chain health, and the high value of this metric is an indicative of a problem.
The return reason indicator offers you insights into the various factors that result in the product return from customers.
The motives that can cause your customers and clients to return their orders are different, however, you can simply break it down into common categories, for example: damaged product category, defective item category, product no longer needed category, etc.
With the help of this KPI you will be able to assess your supply chain areas of weakness, and make improvements to enhance reputation, boost your profits, and decrease returns.
8: Days Sales Outstanding (DSO)
This supply chain KPI measures how fast you’re able to collect payments from customers.
Indeed, a low value of this metric means your financial health is good, and your business takes fewer days to generate revenue from your customers.
On the other hand, a high DSO level reveals that the business takes longer to collect revenue, or a business is selling its product to customers on credit, which can cause slowdown in cash flow and minimize profits.
Days sales outstanding formula:
(Account receivables / Sales) * Days in Period.

9: Days Sales in Inventory (DSI)
This KPI measures the time period that it takes for your inventory to turn into sales.
It is one of the most important metrics that determine the company’s ability to quickly sell its goods and it reflects the good management of your inventory.
if the number is high, it points to inventory management problems or inefficient sales strategy. On the other hand, the lower the number, the better as it indicates the quick selling of inventory which means lower inventory storing cost and less time.
Days Sales in Inventory formula:
DSI= (Average Inventory ÷ Cost of Sales) x 365.
See also What is inventory days formula.
10: Inventory Velocity
Inventory velocity KPI reveals the percentage of inventory that’s estimated for consumption within a given period.
It provides a spotlight about your warehousing, and enables you to meet customer demands effectively, and optimize your inventory levels.
Inventory velocity formula:
Inventory Velocity = Opening Stock / Next Period’s Sales Forecast.
How Many KPIs Do You Need for Supply Chain Management?
Choosing the right key performance indicators KPIs for supply chain management is not the same for all organizations, every business has its own different preferences of the most meaningful KPIs.
But there is one need that all businesses share: managing their supply chain efficiently and developing an efficient supply chain that improves a company’s performance and makes it stronger and smarter.
The process of choosing the right KPIs requires the company to clearly define goals, having the right insights to track progress towards these goals.
Every business should identify the KPIs that will build a completely cohesive supply chain which will best reflect that performance based on its unique needs.
Identifying your needed KPIs is vital to your company as it enables you to focus exclusively on the data that matters, providing useful ones in order to promote the improvement of the entire company.
What to Do and What Not to Do:
- If you don’t measure, then you can’t improve. Do have a set of supply chain KPIs to monitor frequently.
- Having too many KPIs may cause a reverse effect and miss the big picture. Do find the right balance, try to have an average of 10 KPIs as a rule of thumb.
- Do make sure your KPIs represent and lead to goals that are SMART: Specific, Measurable, Achievable, Realistic, and Time-bound.
- Evaluate your chosen KPIs whether they are a fit for your operation before using them. Don’t selectively choose KPIs, make sure to review them regularly to check if they still an appropriate reflection of your supply chain performance.
- Don’t Calculate your KPIs manually, spending more time calculating your indicators may waste your resources, instead, try to leverage from automatic and executive dashboards to simplify the process of importing data, and perform powerful data analysis.
Conclusion
The Importance of Supply Chain Metrics lies in the fact that using the invaluable data that they provide can help businesses run their logistical operations better and improve operational, strategic, and tactical efficiency.
Supply chain KPIs will help you optimize your supply chain to make your business more productive, and more profitable in a competitive commercial world.
At New G Solution, we provide world-class tools for managing orders and inventories, shipping, reporting, planning and multi-channel selling, and more. Our products integrate with different enterprise resource planning (ERP), and shipping companies to put all information you need in hand to provide meaningful business value and boost your business.
Get our free trial now!

Recent Comments